Plotting via CLI
Here is an example of a CLI, written in Python, that plot the sin, cosinus or tan function between -10 and 10:
import argparse
import numpy as np
import matplotlib.pyplot as plt

def plot_function(func):
    x = np.linspace(-10, 10, 400)
    if func == 'sin':
        y = np.sin(x)
        title = 'Sine Function'
    elif func == 'cos':
        y = np.cos(x)
        title = 'Cosine Function'
    elif func == 'tan':
        y = np.tan(x)
        # Exclude values beyond the defined range for tangent
        valid_indices = np.where(np.abs(y) < 10)
        x = x[valid_indices]
        y = y[valid_indices]
        title = 'Tangent Function'
    else:
        raise ValueError("Invalid function. Choose 'sin', 'cos', or 'tan'.")

    plt.plot(x, y)
    plt.title(title)
    plt.xlabel('x')
    plt.ylabel('y')
    plt.grid(True)
    plt.show()

def main():
    parser = argparse.ArgumentParser(description='Plot sine, cosine, or tangent function.')
    parser.add_argument('function', choices=['sin', 'cos', 'tan'], help='Function to plot (sin, cos, tan)')
    args = parser.parse_args()

    plot_function(args.function)

if __name__ == "__main__":
main()Results:
python draw.py sin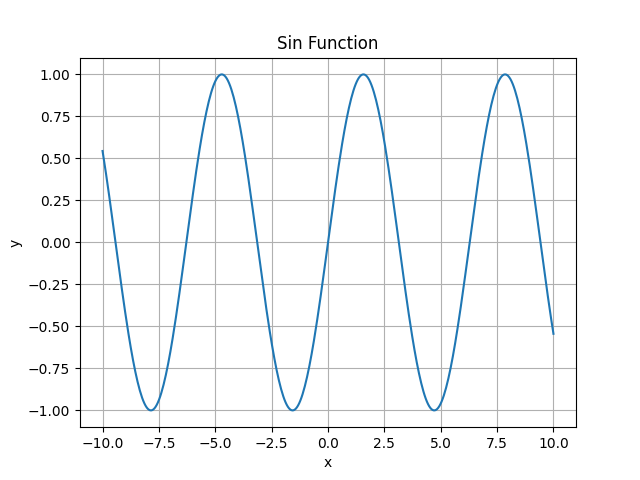
python draw.py cos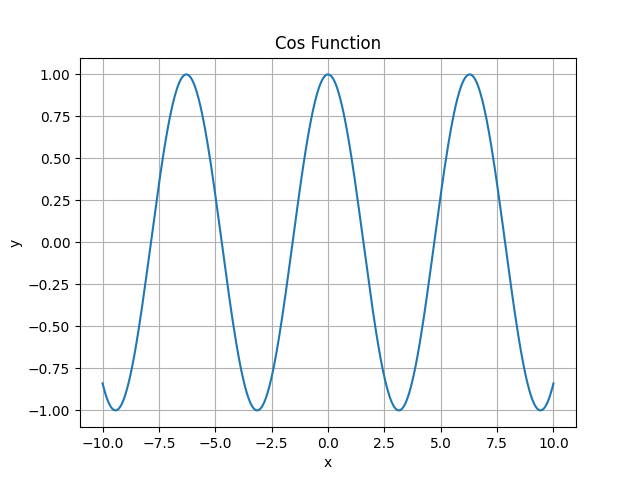
python draw.py tan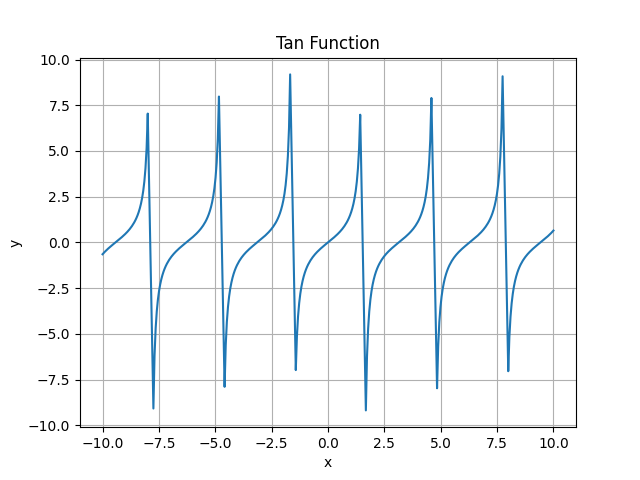
python draw.py --helpusage: draw.py [-h] {sin,cos,tan}
Plot sine, cosine, or tangent function.
positional arguments:
{sin,cos,tan} Function to plot (sin, cos, tan)
optional arguments:
-h, --help show this help message and exit