Scrap & visualize
To scrape data from a website in Python, you can use libraries like requests for making HTTP requests and BeautifulSoup for parsing HTML. Once you've collected the data, you can use libraries like matplotlib or seaborn for visualization.
import requests
from bs4 import BeautifulSoup
import pandas as pd
import matplotlib.pyplot as plt

# Send an HTTP GET request to the webpage
url = "https://bulbapedia.bulbagarden.net/wiki/List_of_Pok%C3%A9mon_by_National_Pok%C3%A9dex_number"
response = requests.get(url)

# Parse the HTML content of the page using BeautifulSoup
soup = BeautifulSoup(response.text, 'html.parser')

# Find the table containing the data
table = soup.find('table', {'class': 'roundy'})

# Initialize lists to store the data
ndex_list = []
pokemon_list = []
type_list = []

# Iterate through the rows of the table
for row in table.find_all('tr')[2:]:  # Skip the first two header rows
    columns = row.find_all('td')

    # Check if there are enough columns to extract data
    if len(columns) >= 5:
        ndex = columns[0].text.strip()
        name = columns[3].text.strip()
        types = [t.text.strip() for t in columns[4].find_all('a')]

        ndex_list.append(ndex)
        pokemon_list.append(name)
        type_list.append('/'.join(types))

# Create a DataFrame from the lists
data = {
    'National Dex Number': ndex_list,
    'Pokemon': pokemon_list,
    'Type': type_list
}

df = pd.DataFrame(data)

print(df)

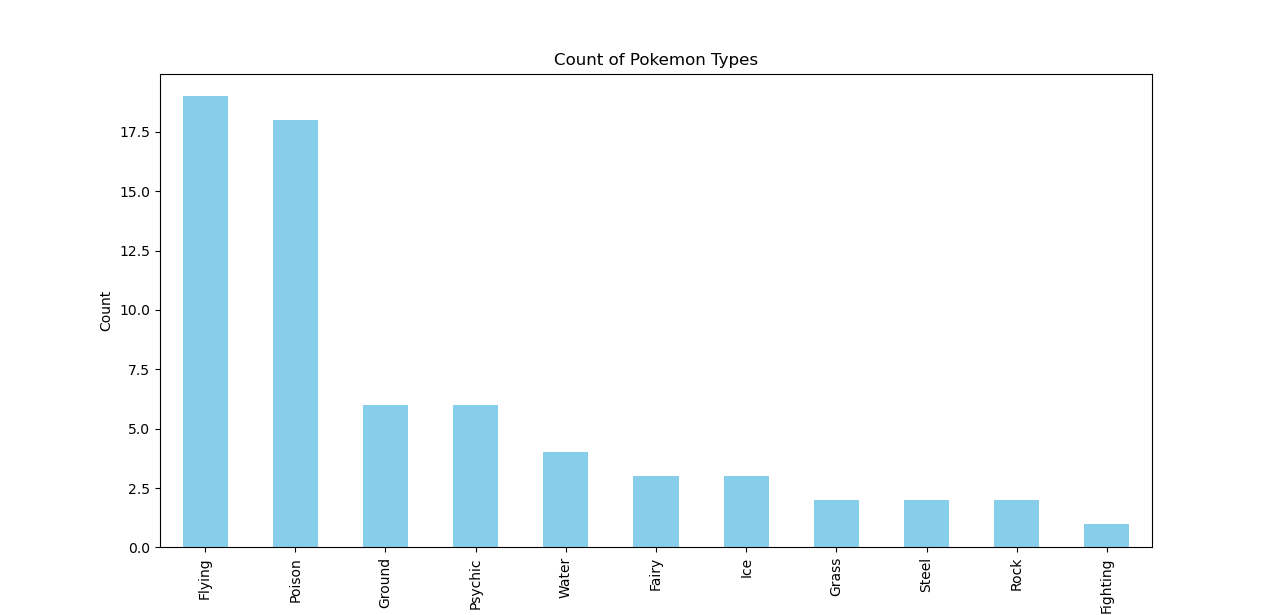
type_counts = df['Type'].value_counts()

# Plot the bar chart
plt.figure(figsize=(10, 6))
type_counts.plot(kind='bar', color='skyblue')
plt.xlabel('Pokemon Type')
plt.ylabel('Count')
plt.title('Count of Pokemon Types')
plt.show()
Results: