load_iris study
The load_iris dataset is a popular toy dataset available in scikit-learn, a widely used machine learning library in Python. It is often used for practicing and testing various classification algorithms. The dataset contains measurements of iris flowers, which belong to three different species: setosa, versicolor, and virginica. Each sample in the dataset represents a different iris flower, and the dataset provides various features (also known as attributes or characteristics) that describe each flower.
The load_iris dataset is a dictionary-like object with the following components:
1. data: This is a 2D NumPy array containing the feature values for each iris sample. Each row represents a different iris flower, and each column corresponds to a specific feature. In the case of the load_iris dataset, there are four features for each flower: sepal length (in centimeters), sepal width (in centimeters), petal length (in centimeters), and petal width (in centimeters).
2. target: This is a 1D NumPy array that contains the target values, or in other words, the class labels for each iris sample. The class labels are encoded as integers, where 0 corresponds to the setosa species, 1 to the versicolor species, and 2 to the virginica species.
3. target_names: This is an array of strings that provides the names of the different classes (species) in the dataset. In this case, it contains the names "setosa", "versicolor", and "virginica".
4. DESCR: This is a string containing a brief description of the dataset. It provides information about the origin of the data, the number of samples and features, as well as the class distribution.
5. feature_names: This is an array of strings that provides the names of the different features in the dataset. In this case, it contains the names "sepal length (cm)", "sepal width (cm)", "petal length (cm)" and "petal width (cm)."
The load_iris dataset is a classic example used in many introductory machine learning tutorials and courses due to its simplicity and well-defined classes. It serves as a good starting point for learning and practicing data analysis, data visualization, and classification algorithms in machine learning.
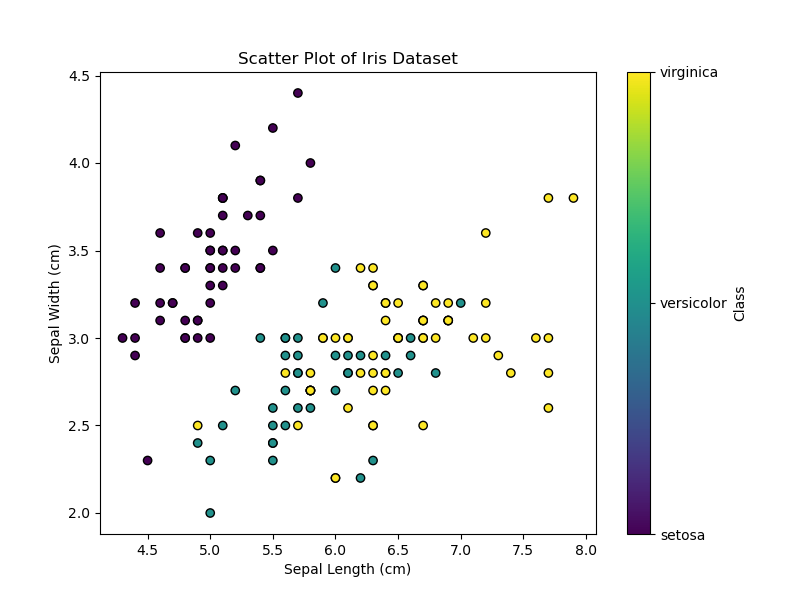
For the load_iris dataset from scikit-learn, which contains measurements of iris flowers, I would recommend using a scatter plot with color-coding for different classes. A scatter plot is a simple yet powerful visualization that can effectively display relationships and patterns between multiple variables, making it suitable for this dataset with four features.
Here's why a scatter plot is a good choice:
1. Feature Comparison: The load_iris dataset contains four features: sepal length, sepal width, petal length, and petal width. A scatter plot allows you to visualize the relationships between any two of these features simultaneously, helping to identify potential correlations or separations between classes.
2. Easy to Interpret: Scatter plots are easy to understand even for non-experts. Each data point represents an observation, and the position on the plot is determined by the values of two features. By using color to represent different classes of iris flowers, it becomes straightforward to see how the classes are distributed across the feature space.
3. Handling Multiclass Data: The load_iris dataset has three classes of iris flowers (setosa, versicolor, and virginica). Using different colors for each class allows you to distinguish them easily on the scatter plot. You can either use standard colors like red, green, and blue or choose a colormap that offers better contrast and differentiation.
4. Potential Outliers: Scatter plots help you identify any potential outliers in the dataset. Outliers are data points that significantly deviate from the overall pattern, and they can be critical in certain analyses or machine learning tasks.