MongoDB visualization
To visualize the data from a MongoDB collection in Python, you can use various libraries and tools to retrieve and display the data. One common way to do this is by using the Pandas library for data manipulation and Matplotlib or Seaborn for data visualization. Here's a step-by-step guide on how to visualize a MongoDB collection in Python:
- Connect to MongoDB:
Use the PyMongo library to connect to your MongoDB database and collection. Replace "<your_connection_string>", "<your_database_name>", and "<your_collection_name>" with your specific MongoDB configuration.
from pymongo import MongoClient
import matplotlib.pyplot as plt
import pandas as pd

# Connect to MongoDB
client = MongoClient("")
db = client[""]
collection = db[""] Use PyMongo to query and retrieve data from your MongoDB collection. For example, to retrieve all documents in the collection, you can use the following code:
data = list(collection.find())Create a Pandas DataFrame from the retrieved data. This will allow you to manipulate and visualize the data easily.
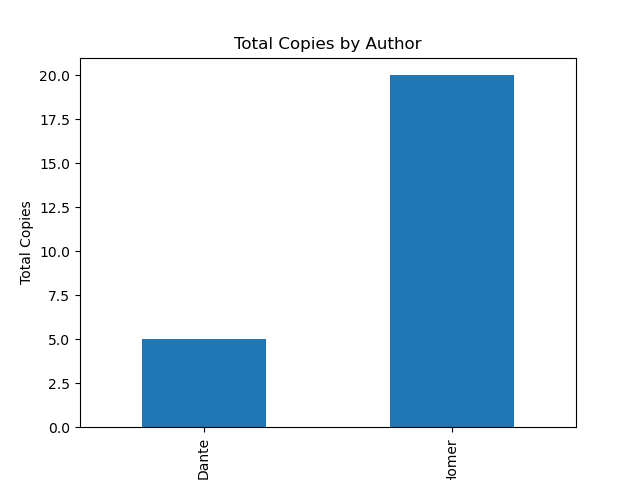
df = pd.DataFrame(data)Depending on your data and visualization requirements, you can use Matplotlib or Seaborn to create various types of plots and charts. Here's an example of creating a simple bar chart to visualize book copies:
# Group data by author and sum the copies
author_copies = df.groupby("author")["copies"].sum()

# Create a bar chart
author_copies.plot(kind="bar")
plt.title("Total Copies by Author")
plt.xlabel("Author")
plt.ylabel("Total Copies")
plt.show()
Result:
This is just a starting point, and you can create more sophisticated visualizations and analysis based on your data and requirements.