Word cloud

A word cloud is a visual representation of text data where the size of each word corresponds to its frequency or importance within the text. It provides a quick and intuitive way to visually analyze and understand the most prominent terms in a collection of text.

In a word cloud, words are typically displayed in a randomized arrangement, with more frequently occurring words appearing larger and bolder than less frequent ones. The overall layout and color scheme of a word cloud can vary, but the emphasis is usually on making the word sizes and positions visually distinct.

Word clouds are useful for gaining insights into the key themes, topics, or sentiments present in a body of text. By visually highlighting the most frequently used words, they can help identify patterns, trends, or the main focus of the text. Word clouds are often employed in various contexts, including social media analysis, text mining, content analysis, and summarization.

It's important to note that word clouds have limitations. They do not provide detailed context or semantic relationships between words. The analysis should be accompanied by other techniques to fully understand the underlying meaning and context of the text data.
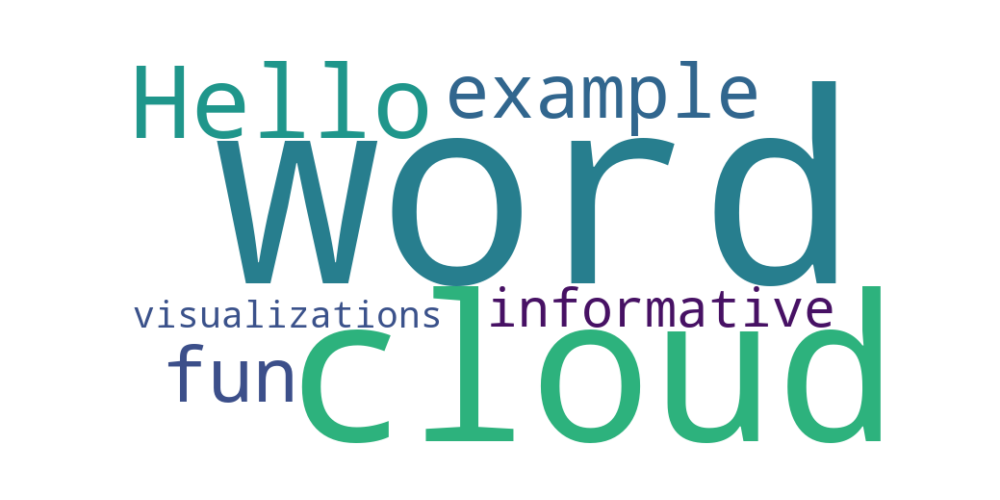
Python Example

import matplotlib.pyplot as plt from wordcloud import WordCloud # Example text data text_data = "Hello, how are you? This is an example of a word cloud. Word clouds are fun and informative visualizations." # Create a WordCloud object wordcloud = WordCloud(width=800, height=400, background_color='white').generate(text_data) # Plot the word cloud plt.figure(figsize=(10, 5)) plt.imshow(wordcloud, interpolation='bilinear') plt.axis('off') plt.show()

In this example, we start by importing the necessary libraries: matplotlib.pyplot for plotting and WordCloud from the wordcloud library.

Next, we define the text data that we want to visualize as a word cloud. In this case, the text is stored in the text_data variable.

We then create a WordCloud object, specifying the desired width, height, and background color. In this case, we set the width to 800 pixels, height to 400 pixels, and background color to white.

Finally, we plot the word cloud using plt.imshow() and display the resulting visualization using plt.show().

When you run this code, you should see a window pop up displaying the word cloud visualization of the given text data. The size and positioning of the words will reflect their frequency or importance within the text.

word cloud result