Treemaps
Treemaps are a type of hierarchical data visualization that uses nested rectangles to represent hierarchical structures and display relative proportions of different data elements. They provide a compact and efficient way to visualize large amounts of hierarchical data.
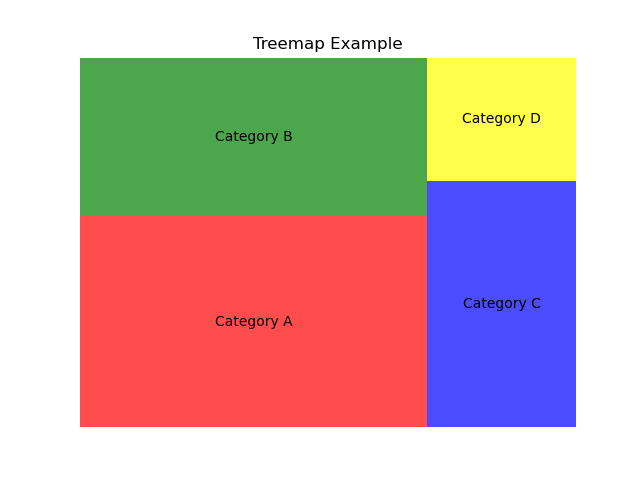
In a treemap, the overall rectangular area represents the entire dataset, and each nested rectangle within it represents a specific category or subcategory. The size of each rectangle is proportional to a specific attribute or value associated with that category.
Typically, treemaps use color coding or shading to encode additional information, such as differentiating between categories or indicating the magnitude of a particular variable. This allows for quick visual identification of patterns, hierarchies, and relative proportions within the data.
Treemaps are particularly useful when visualizing hierarchical data with multiple levels or when comparing the relative sizes of different categories. They are commonly used in various domains, including finance, market analysis, file systems, and organizational structures, among others.
The arrangement of rectangles in a treemap can be done using different algorithms, such as the squarified, slice-and-dice, or ordered layouts, depending on the specific implementation and desired aesthetic.