Tree diagram

A tree diagram is a type of hierarchical visualization that represents the structure and relationships between different elements or categories of data. It uses a branching structure similar to a tree, where each branch represents a category or subcategory, and the branches further divide into smaller branches or leaf nodes.

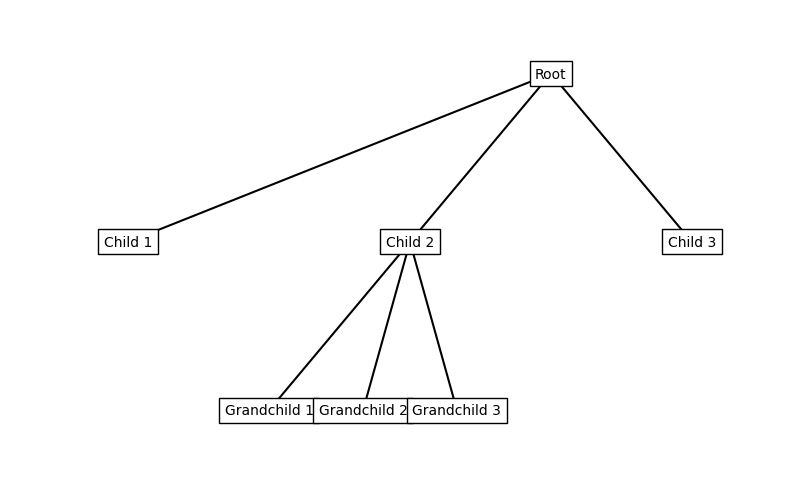
In a tree diagram, the main or root node is placed at the top, and it branches out into child nodes. These child nodes can then have additional child nodes, forming a hierarchical structure. The branches or connections between nodes indicate the relationships or dependencies between them.

Tree diagrams are commonly used to represent hierarchical data structures, such as organizational charts, family trees, file directory structures, decision trees, and taxonomies. They provide a visual representation that helps users understand the relationships, dependencies, and levels of a system or data.

The nodes in a tree diagram can be labeled with names, categories, or other relevant information, and they can also be assigned different visual attributes like colors or shapes to convey additional information or distinctions.

Tree diagrams are valuable in organizing and visualizing complex information in a clear and structured manner, making it easier to analyze and comprehend the relationships and hierarchy within a dataset or system.
Python Example

import matplotlib.pyplot as plt # Define the data for the tree diagram tree_data = { 'Root': { 'Child 1': {}, 'Child 2': { 'Grandchild 1': {}, 'Grandchild 2': {}, 'Grandchild 3': {}, }, 'Child 3': {}, } } # Define a recursive function to plot the tree diagram def plot_tree(ax, data, x, y, dx, dy): if not data: return ax.text(x, y, list(data.keys())[0], ha='center', va='center', bbox=dict(facecolor='white')) children = data[list(data.keys())[0]] if children: dx = dx / len(children) x_left = x - dx * len(children) / 2 for i, child in enumerate(children): x_child = x_left + i * dx ax.plot([x, x_child], [y, y-dy], '-k') plot_tree(ax, {child: children[child]}, x_child, y-dy, dx, dy) # Create the plot fig, ax = plt.subplots(figsize=(8, 6)) ax.axis('off') # Call the plot_tree function to create the tree diagram plot_tree(ax, tree_data, 0.5, 1, 0.8, 0.2) # Display the tree diagram plt.show()

In this example, we define a tree_data dictionary that represents the hierarchical structure of the tree diagram. The keys represent the nodes, and the values are dictionaries representing their children.

The plot_tree function is a recursive function that takes in the ax (axes) object, the data, the position of the current node (x and y), and the spacing (dx and dy). It recursively plots the nodes and their connections using the ax.plot function and calls itself to plot the child nodes.

Finally, we create a plot using matplotlib, set the axes off, and call the plot_tree function with the provided data and parameters.

When you run this code, it will display a tree diagram with the defined hierarchy. You can modify the tree_data dictionary to represent your own hierarchical structure and visualize it using this code.

tree diagram result