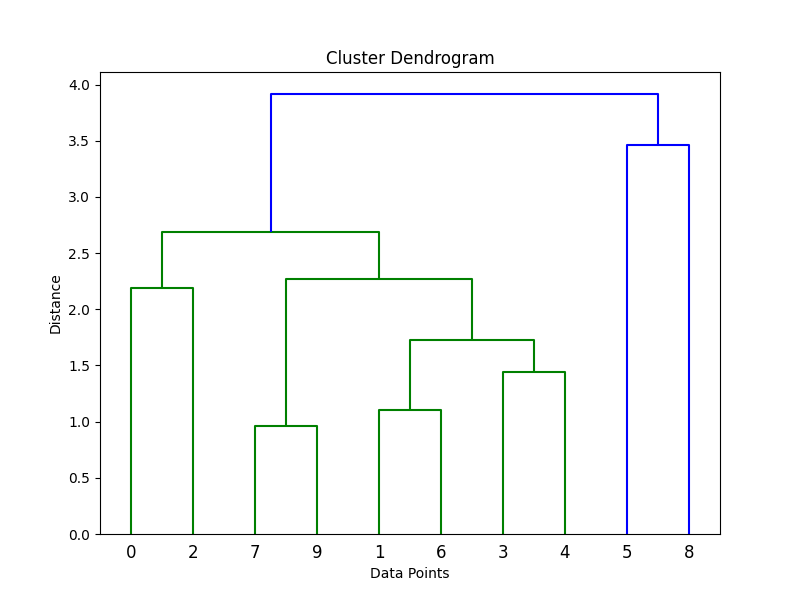
Cluster dendrogram
A cluster dendrogram is a type of hierarchical data visualization that represents the relationships and similarities between data points in a hierarchical manner. It is commonly used in the field of data analysis and clustering.
The dendrogram consists of a tree-like structure, where each data point is represented by a leaf or a branch on the tree. The height or vertical position of each leaf or branch indicates the similarity or dissimilarity between the data points it represents.
At the beginning, each data point is represented as an individual leaf at the bottom of the dendrogram. As the dendrogram builds upwards, similar data points are grouped together into clusters. The height of the branches or merging points in the dendrogram indicates the level of similarity at which the data points are combined.
The arrangement and clustering of the data points in the dendrogram can be determined using different methods, such as hierarchical clustering algorithms like agglomerative clustering or divisive clustering.
Cluster dendrograms provide a visual representation of the relationships and structures within a dataset. They are useful for identifying clusters, subclusters, and outliers within the data. Dendrograms can also assist in determining the optimal number of clusters to use in subsequent analyses or clustering tasks.
Overall, cluster dendrograms serve as a powerful tool for understanding the hierarchical organization and similarities between data points in a dataset.