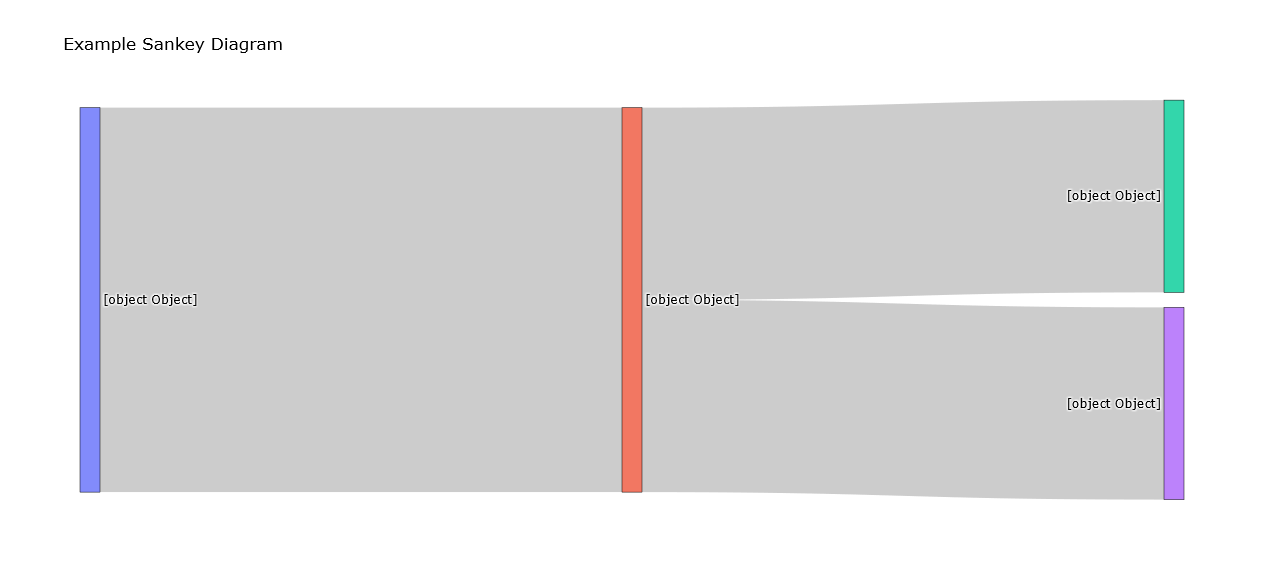
Sankey diagram
A Sankey diagram is a type of flow diagram that visually represents the flow of quantities or values between different entities or stages. It illustrates the magnitude and direction of flow as well as the relationship between the entities involved. Sankey diagrams are particularly useful for showing the distribution, transfer, or transformation of resources, energy, or data.
The diagram consists of nodes (representing entities or categories) and directed links (representing flows). The width of the links is proportional to the quantity or value being visualized, allowing for quick comparison and understanding of relative magnitudes. The flow typically starts from a source node and ends at a destination node, with intermediate nodes representing stages or transitions along the flow path.
Sankey diagrams provide a clear visualization of how inputs are transformed and distributed across different pathways or processes. They help identify bottlenecks, inefficiencies, or imbalances in the flow and can be used to analyze and optimize systems or processes. Sankey diagrams are commonly used in fields such as energy management, environmental analysis, logistics, and data visualization to present complex flow data in an intuitive and informative way.
Overall, Sankey diagrams offer a powerful visual representation of the flow and allocation of resources, making it easier to understand and communicate complex relationships and patterns.