Clustering
Clustering is a technique used in machine learning to group similar objects or data points together based on their characteristics or features. It's like sorting things into different categories based on their similarities.
Imagine you have a bunch of fruits, and you want to group them together based on their properties. You might have apples, bananas, and oranges. To cluster them, you would look at their features, such as their color, shape, and size.
Let's say you find that most of the red and round fruits belong to the apple cluster. Similarly, the yellow, elongated ones belong to the banana cluster, and the orange, spherical ones belong to the orange cluster. By looking at these features, you can separate the fruits into different groups or clusters.
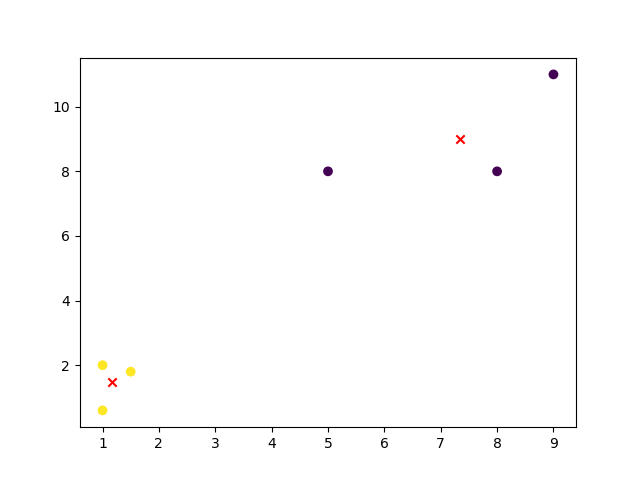
In machine learning, clustering algorithms work in a similar way. They analyze the characteristics or features of the data points and try to find patterns or similarities. The algorithm automatically groups the data points that are alike into different clusters, without knowing the specific labels or categories in advance.
The goal of clustering is to identify groups or clusters of data points that are internally similar but differ from other groups. It helps in discovering patterns or structures within the data and can be useful for tasks such as customer segmentation, image recognition, anomaly detection, and more.
Clustering algorithms make the process of grouping data points efficient by using mathematical calculations and optimization techniques. They analyze the distances between data points, looking for similarities or dissimilarities. Based on these calculations, the algorithm assigns each data point to a specific cluster.
Overall, clustering is a powerful tool in machine learning that allows us to organize data into meaningful groups based on their shared characteristics.