Neural Network Loss
In the context of neural networks, "loss" refers to a measure of how well the network is performing a given task. It quantifies the disparity between the predicted outputs of the network and the expected or desired outputs.
Imagine you have a neural network that is trained to recognize different types of fruits based on their images. During the training process, the network makes predictions about the fruit type for a set of input images, and these predictions are compared to the correct labels for those images. The loss is a numerical value that indicates how far off the network's predictions are from the actual labels.
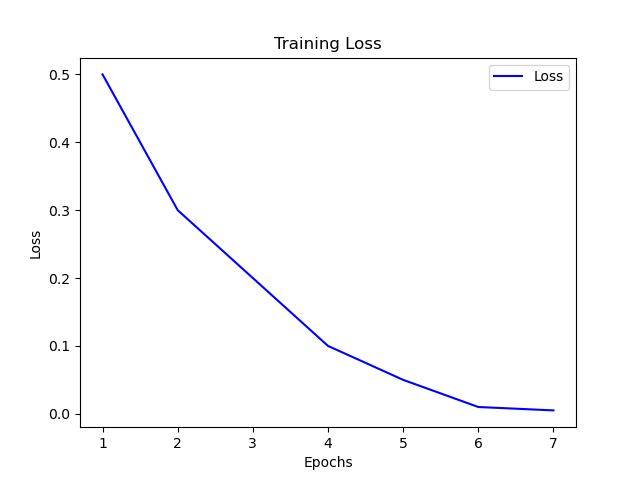
The goal of training a neural network is to minimize this loss. By adjusting the network's parameters through a process called backpropagation, the network learns to make better predictions and reduce the loss over time. The idea is that as the network becomes more accurate, the loss decreases, and the network gets closer to correctly recognizing the fruit types.
In simple terms, you can think of loss as a measure of how much a neural network "misses the mark" in its predictions. By minimizing this loss, we aim to improve the network's performance and make it better at its intended task.