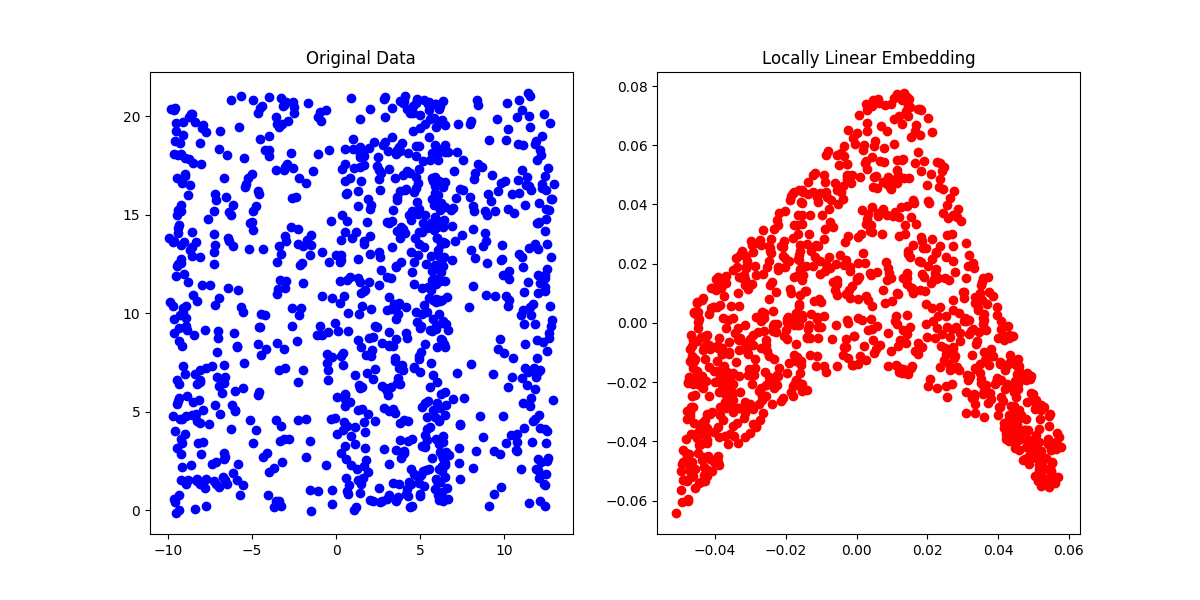
Locally Linear Embedding
The LLE algorithm stands for "Locally Linear Embedding" algorithm. It's a method used in machine learning to simplify and understand complex data by finding simpler patterns within it.
Here's a simple breakdown of how it works:
- Data Representation: First, the algorithm takes your data, which could be anything from images to text to numerical data, and represents it in a high-dimensional space. This means each data point is represented by a bunch of numbers (features) that describe it.
- Local Linearity: LLE looks at each data point and tries to find its nearest neighbors. It then assumes that the data in that neighborhood can be represented as a linear combination of those neighbors. This is based on the idea that things close together in the original space should behave similarly.
- Mapping: Once it has these local linear relationships, LLE tries to map the data to a lower-dimensional space while preserving these local relationships as much as possible. In other words, it tries to find a simpler way to represent the data without losing too much important information.
- Dimensionality Reduction: The end result is a lower-dimensional representation of the data that captures its essential structure. This can be useful for tasks like visualization, where it's easier to understand data in two or three dimensions rather than the original high-dimensional space.
Overall, LLE helps simplify complex data by finding local linear relationships and mapping it to a lower-dimensional space while preserving those relationships.